
Universal input
Start with common research formats.
Load CSV and TSV files or pass MATLAB variables into the platform.
Data Visualization Platform
Explore data. Keep the views connected. DVP is an interactive research prototype for plotting data, creating linked selection groups, and moving work between a visual interface and MATLAB.
Alpha research software. The browser prototype is preserved as part of the project record.

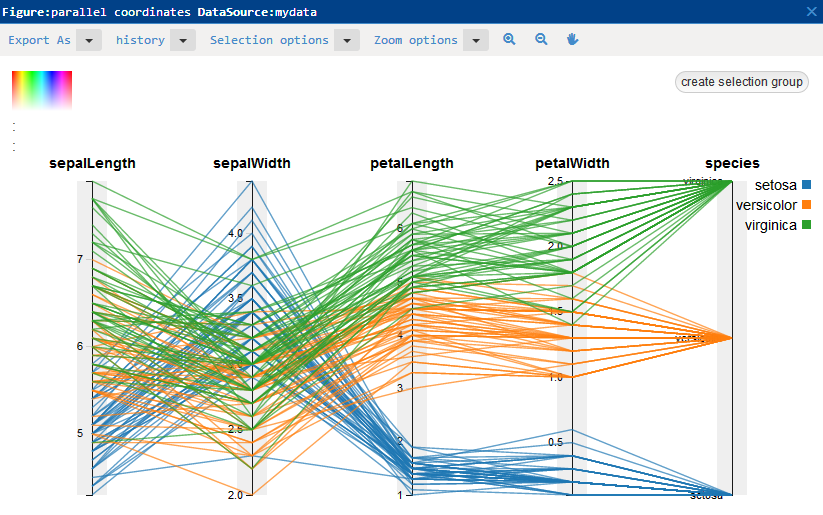
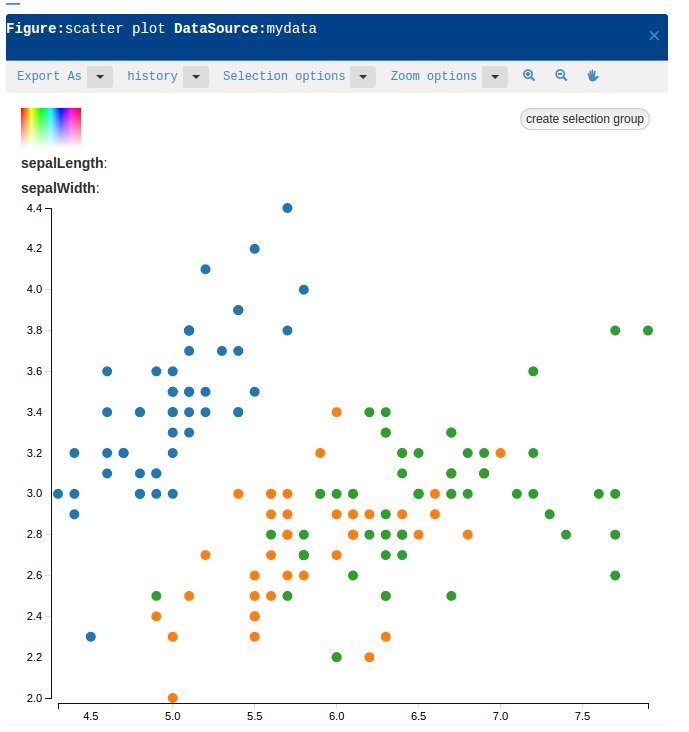
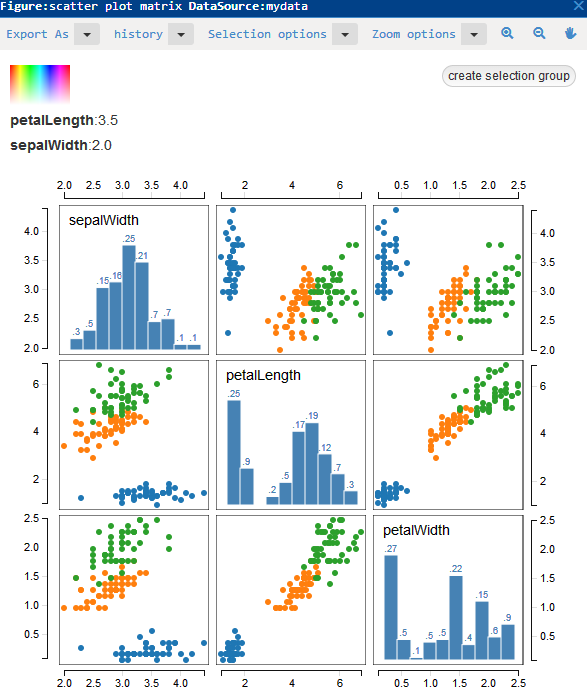
Historical DVP views presented in one linked workspace.
Core features
The original project separated these features across several pages. They now sit together in one clear overview.
Universal input
Load CSV and TSV files or pass MATLAB variables into the platform.
Linked figures
Use scatter plots, matrix plots, parallel coordinates, histograms, and linked selections.
Selection groups
Create named groups, annotate observations, and carry the same selection between figures and MATLAB.
Custom plots
The interface maps actions to functions, allowing plots and parameters to be customized programmatically.
Scripting
A JavaScript-based scripting layer was designed for custom plotting methods and animations.
Hardware workflows
The project also explored interfaces for devices such as Arduino and Raspberry Pi.
MATLAB bridge
DVP acts as a MATLAB toolbox. Figures, data sources, and selection groups can be created or retrieved from MATLAB while changes remain available in the visual environment.
The original toolbox files are kept with this project.
No separate installer is required for the toolbox files.
Create data sources, plots, and selection groups through straightforward function calls.
dvpCreateDataSource(data, dataSourceName)
dvpScatter(dataSource, figureName, feature, numberOfBins)
dvpMatrixPlot(dataSource, figureName, dimensions, groupsCol)
dvpParallel(dataSource, figureName, dimensions, groupsCol)
dvpHist(dataSource, figureName, feature, numberOfBins)
dvpCreateSelectionGroup(selection, dataSourceId, groupName)
Recorded walkthrough
The recording shows the historical research prototype and its interactive workflow. It opens in a new tab.
Watch on YouTube ↗Bring data into the platform and work with several figures from the same source.
Highlight observations in one view and inspect the corresponding data across others.
Use the interface for exploration and MATLAB for programmatic control.
Downloads & prototype
These files are preserved as alpha research software. They are not presented as a current supported product.
Browser prototype
The original Angular-based interface remains available for historical exploration.
Open the legacy prototype ↗Alpha files
The Windows alpha package and MATLAB bridge files are preserved locally with this redesign.
Download DVP for Windows ↓Contact
The email address appears only after you click.